
 "The eCommerce Metrics That Actually Matter...And Why Capturing Them Matters Even More")
When people talk about ecommerce performance, the conversation almost always starts in the same place. Conversion rate, average order value, and revenue dominate most discussions about how a site is performing.
These metrics clearly matter. They tell us whether the business is growing and whether the ecommerce website is commercially healthy.
But they rarely explain why performance is changing.
One of the things we see regularly when working with ecommerce brands is dashboards full of numbers that don’t actually explain what customers are doing on the site. Teams are often looking at outcomes without understanding the behaviour that leads to those outcomes.
So before we talk about optimisation strategies or CRO programmes, we usually start somewhere much simpler.
We ask a basic question: Does the data even make sense?
The first thing we do when reviewing ecommerce data.
When we gain access to a new Google Analytics property, the first few minutes of digging usually reveal quite a lot.
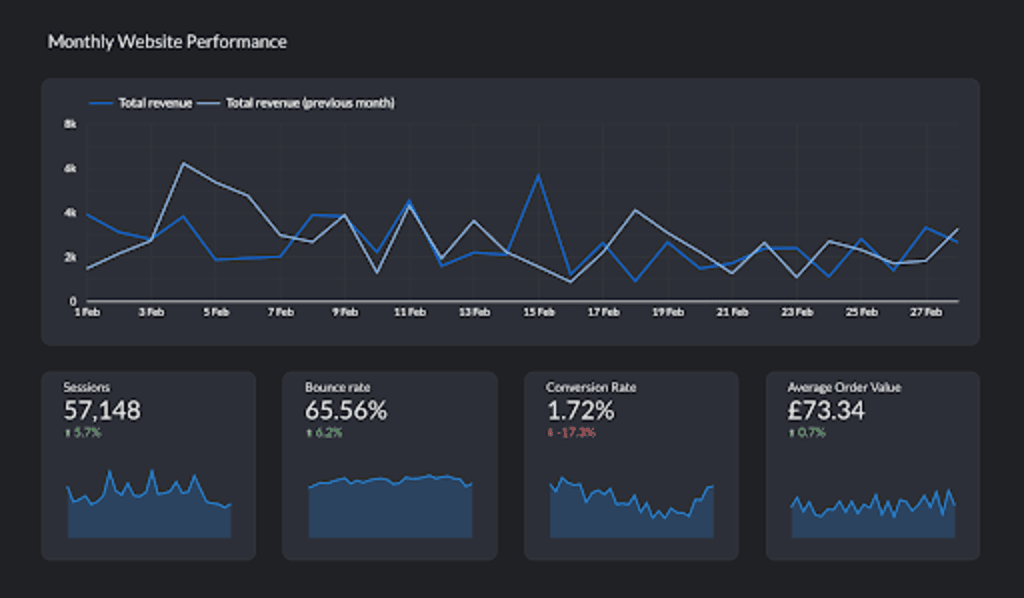
Rather than diving into complex reports, we start by reviewing a small set of simple headline metrics. These provide an immediate snapshot of how the store is performing and whether the numbers appear believable.
The first metrics we typically review include:
Revenue
Transactions
Sessions
Users
Bounce rate
Conversion rate
Average order value
These numbers quickly provide a baseline for performance. They also highlight whether there are any obvious anomalies in the data that might point to tracking issues that are impacting internal optimisation and channel performance.
For example, if revenue looks unusually high compared to transaction volume, or bounce rates appear unrealistically low, it can often indicate problems with the analytics implementation.
You’d be surprised how often these quick checks uncover issues before deeper analysis even begins.
Most teams commonly skip event tracking.
Once the headline metrics have been reviewed, the next step is something many teams overlook entirely. We examine the event tracking across the GA4 property.
Looking at event counts quickly reveals which interactions are actually being captured across the site. If the event structure is incomplete or inconsistent, it becomes very difficult to understand how customers move through the shopping journey.
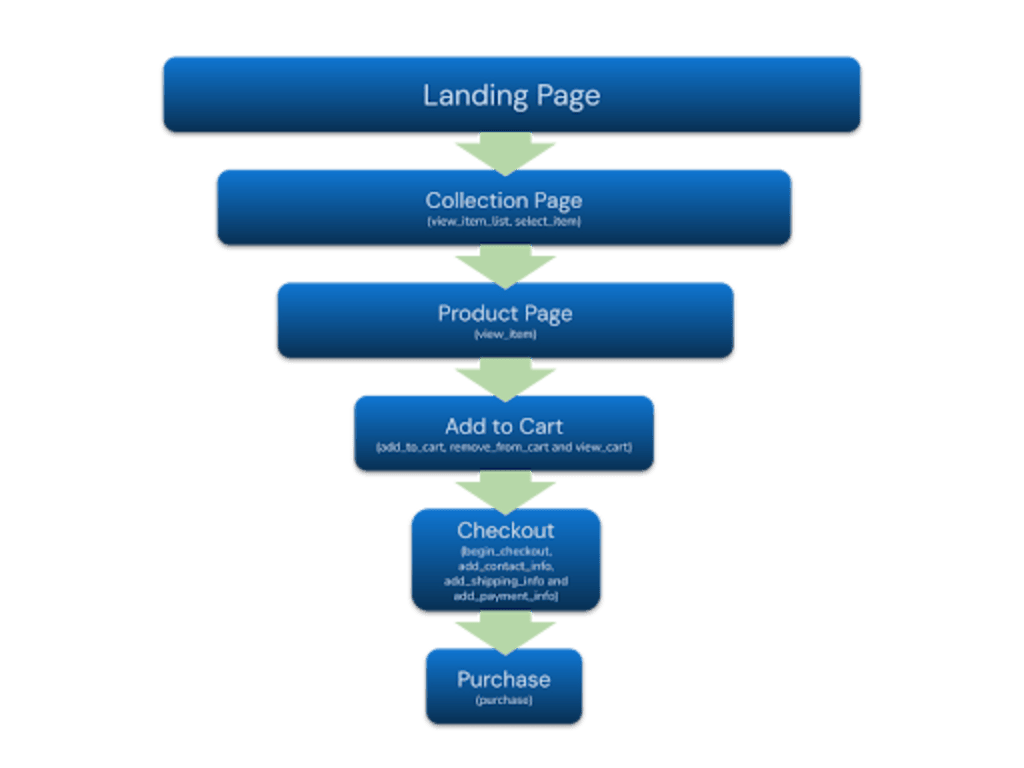
For an ecommerce store to analyse behaviour properly, certain interactions should normally be tracked.
Typical ecommerce events include:
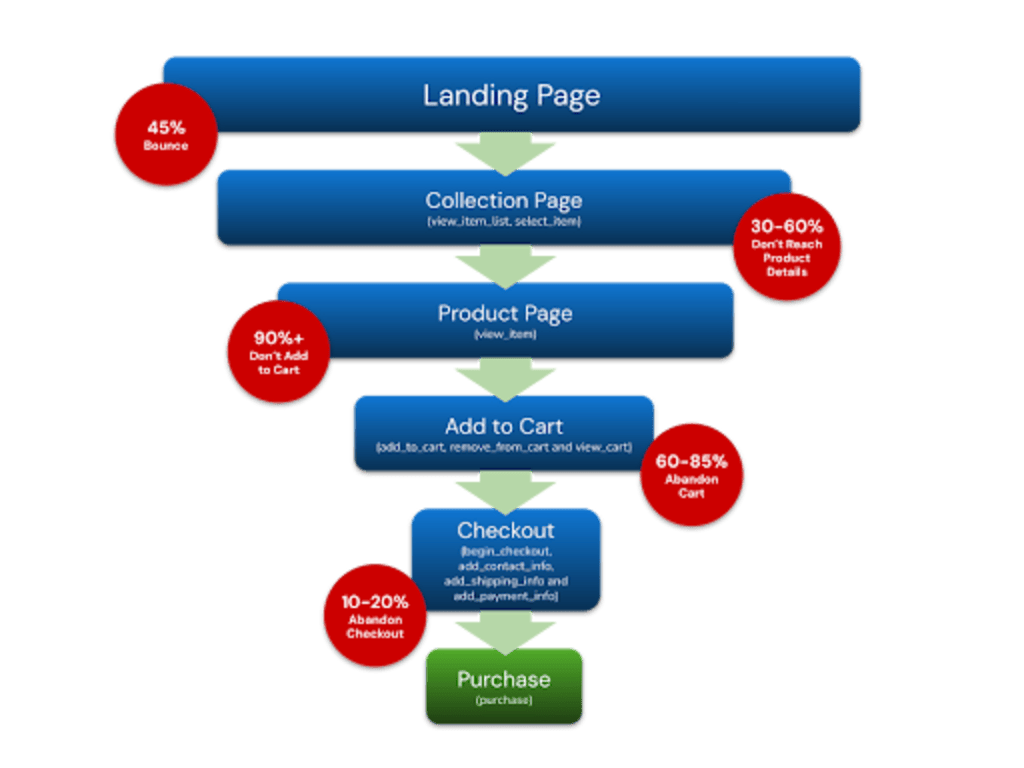
view_item_list - when a collection if viewed
view_item - when a product page is viewed
select_item - when a product is selected from a list or collection
add_to_cart - when a product is added to the basket
begin_checkout - when a shopper starts checkout
add_contact_info - when contact data is added at checkout
add_shipping_info - when shipping information is added
add_payment_info - when payment information is submitted
purchase - when an order is completed
If these signals aren’t present, we lose visibility into the most important parts of the customer journey. At that point, optimisation becomes guesswork.
Why capturing behavioural data matters, beyond on-site optimisation.
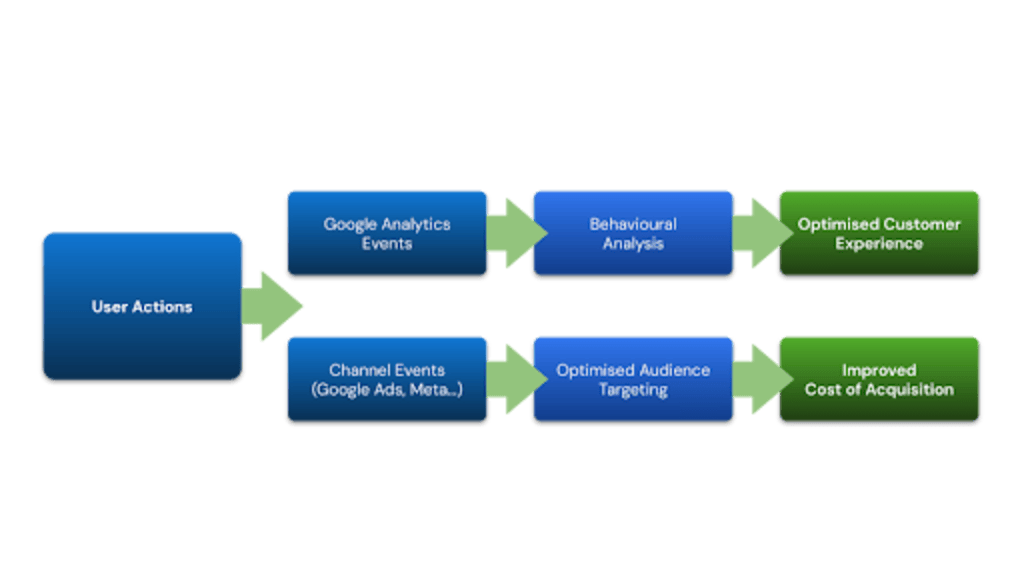
Capturing these interactions isn’t just useful for reporting. It also plays a critical role in how marketing platforms optimise performance. Platforms like Google, Microsoft and Meta rely heavily on behavioural signals to understand which users are likely to convert.
If the only signals available are:
Sessions
Page views
Purchases
Then, advertising platforms have very little context about how customers interact with the site before buying.
However, when richer signals exist, such as:
product views
add-to-cart actions
checkout starts
These events create a much clearer picture of user intent and help platforms identify other lookalikes and potential customers.
This behavioural data allows advertising platforms to train their optimisation models more effectively and find users who behave similarly to existing customers. In simple terms, better event data helps advertising platforms optimise more intelligently.
The data issues we see most often.
After reviewing many ecommerce analytics implementations over the years, a few patterns tend to repeat. These issues often appear within the first few minutes of reviewing a GA4 property.
Some of the most common problems include:
Missing ecommerce tracking
Key product events may be missing entirely, which makes it impossible to understand the customer journey.
Double counting
Tags sometimes fire multiple times, inflating event volumes and distorting reporting.
Large volumes of “not set” data
This often indicates tagging gaps or attribution issues.
None of these issues is unusual, but they can significantly reduce the usefulness of analytics if they aren’t addressed.
Why do we compare GA4 with Shopify?
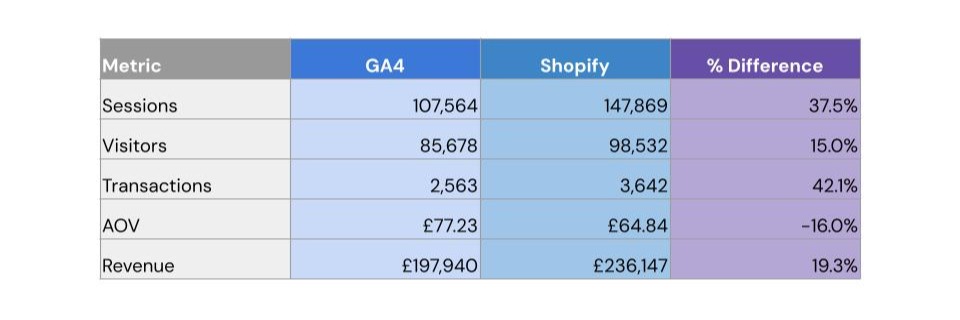
One of the most useful exercises when reviewing ecommerce performance is comparing GA4 data with Shopify data.
This comparison helps validate whether tracking and consent settings are behaving correctly.
Within Shopify, we typically review:
Sessions
Website visitors
Transactions
We then compare these figures against GA4.
If both platforms show similar trends and roughly aligned transaction numbers, it provides confidence that tracking is behaving correctly.
If the numbers diverge significantly, it often points to issues such as:
consent suppression
incomplete tracking
attribution discrepancies
third-party scripts affecting event firing
This simple comparison can reveal tracking issues very quickly and bring back confidence to businesses about why these two platforms never correlate with each other.
The metrics that ecommerce leaders usually focus on.
When ecommerce directors ask how a site is performing, the conversation usually centres around two numbers: conversion rate and average order value. These metrics provide a quick commercial snapshot, but they rarely explain what is happening inside the customer journey.
For example, if the conversion rate drops, the instinct might be to review checkout or promotions. But the problem may actually sit much earlier in the journey. Customers might not be adding products to their basket in the first place. Or they may be struggling to find products that match their intent.
Looking purely at outcome metrics often hides these behavioural issues.
The behavioural metrics that actually move performance.
Rather than focusing only on outcomes, we encourage ecommerce teams to look closely at behavioural signals. These metrics reveal how users progress through the shopping journey.
Some of the most valuable behavioural indicators include:
Add-to-cart rate
Begin checkout rate
Cart abandonment rate
Product views per session
Product engagement levels
These signals help identify where friction exists and where customers begin to drop out of the journey.
For example:
Low add-to-cart rates may indicate product page issues
High checkout abandonment may indicate shipping or payment friction
Low product engagement may indicate navigation or merchandising problems
Understanding these signals allows teams to focus optimisation efforts where they will have the greatest impact.
Changing the conversation around eCommerce performance.
Analysing behavioural metrics changes the nature of performance discussions. Instead of asking why revenue has changed, teams begin asking more useful questions.
Questions like:
How do we improve add-to-cart rates?
How can we increase checkout completion?
How can we help customers find products faster?
These conversations lead naturally into experimentation, optimisation, and customer journey improvements. Over time, this helps teams move away from reactive reporting and towards proactive growth.
The opportunity most eCommerce teams already have.
Most ecommerce businesses already have access to the data they need to improve performance. The challenge isn’t a lack of numbers. It’s understanding which metrics genuinely reflect customer behaviour.
By validating tracking, comparing platforms, and analysing behavioural signals within the journey, teams can build a far clearer picture of how customers interact with their store. Once that understanding exists, improving performance becomes far less guesswork.
Stop guessing. Start growing.
Ready to turn your data into a growth engine? Whether you need a technical audit to fix your tracking or a full-scale optimisation strategy, we’re here to help. Read more about our services to see how we refine the eCommerce journey, browse our work to see the results we’ve delivered, or get in touch today for a candid conversation about your data.


